

UX/UI design · Data & AI
F1 PitWall
What we see of a race depends entirely on what the TV director decides to show.
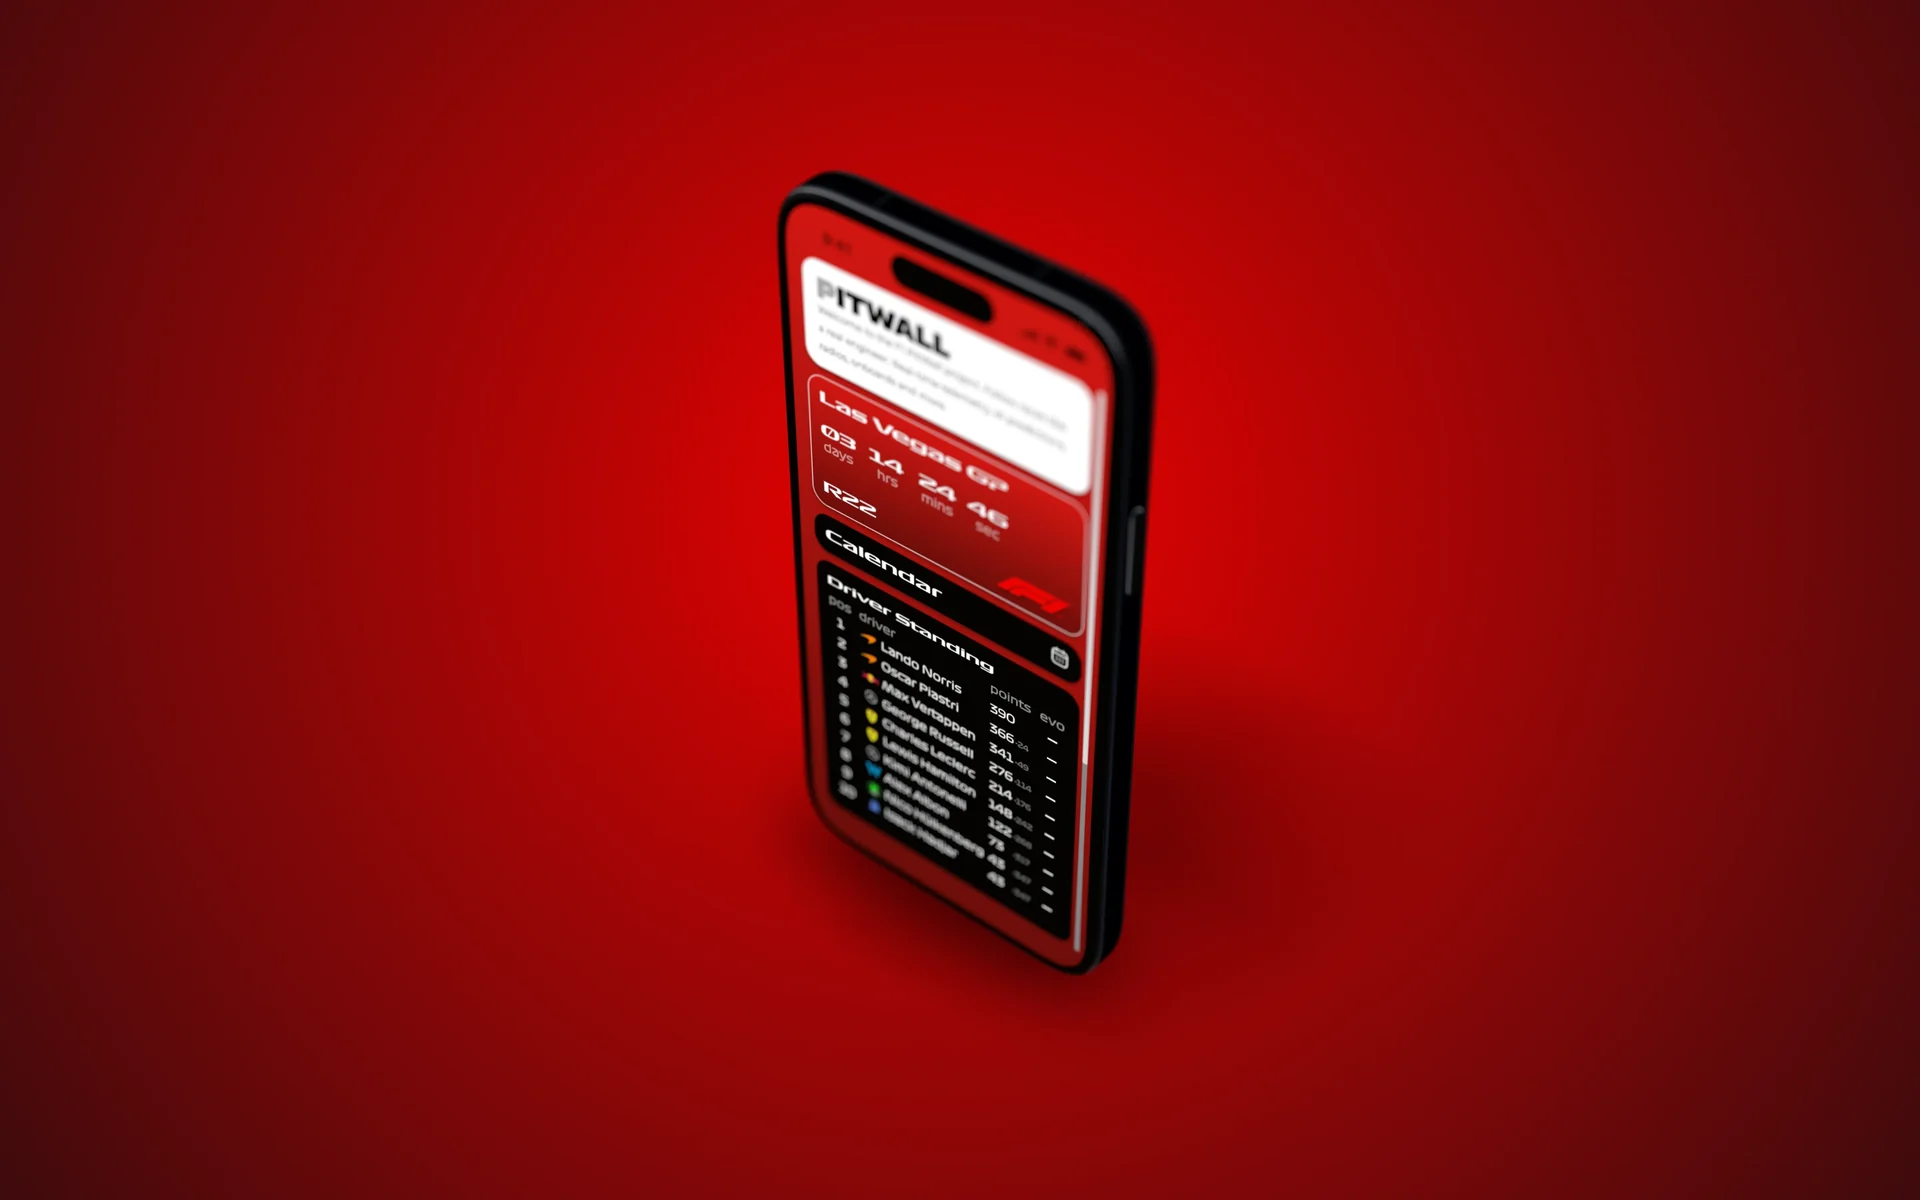
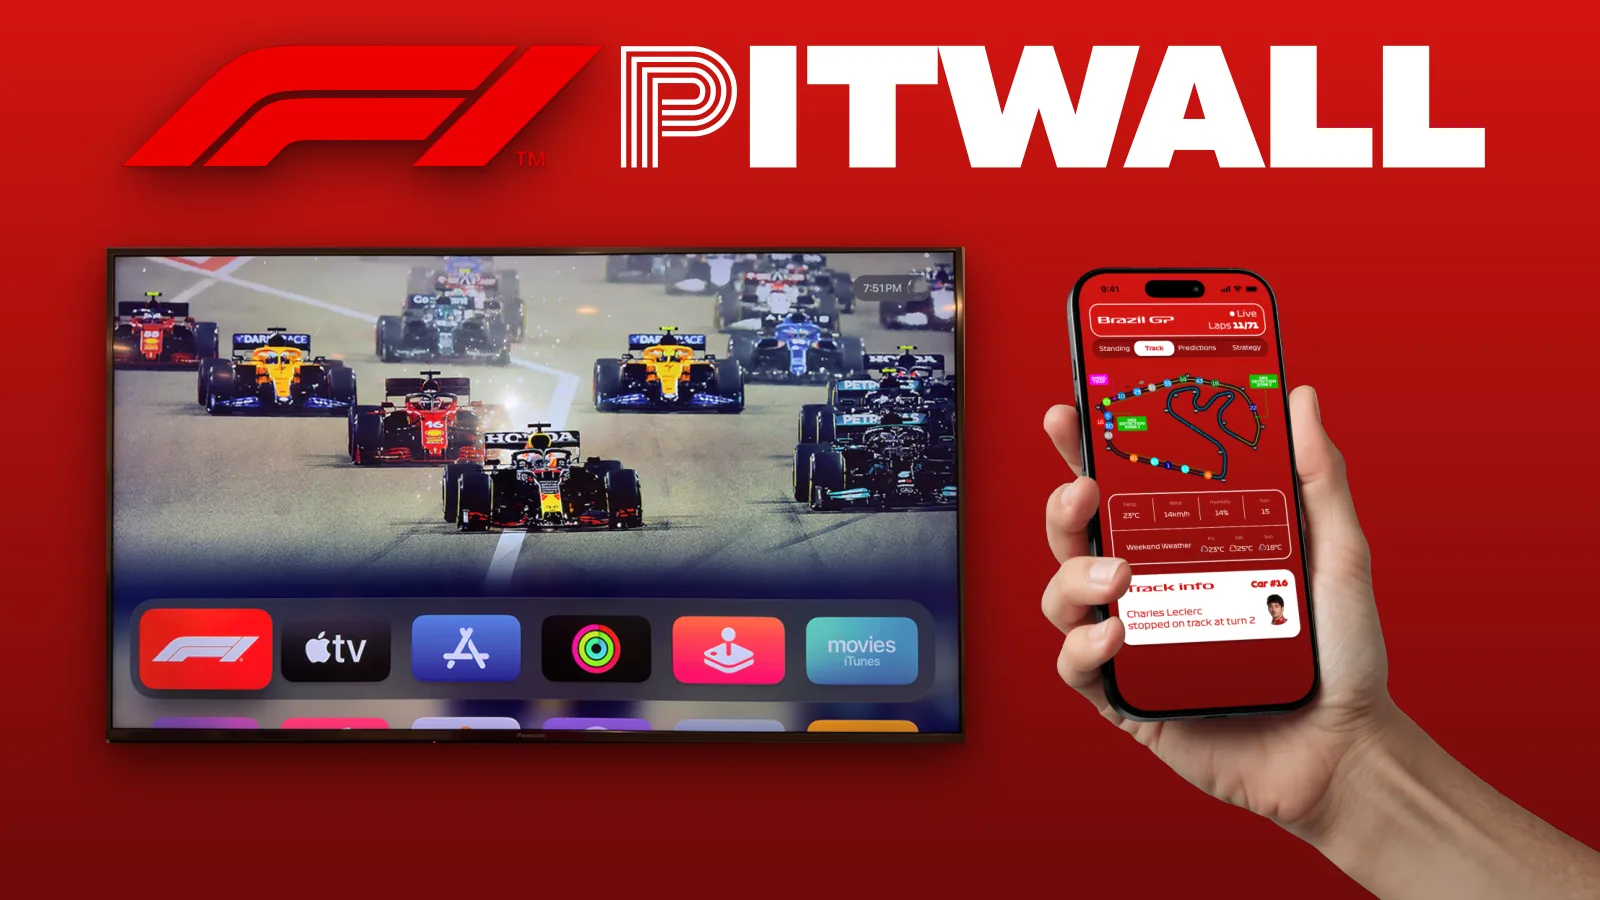
I designed a second-screen app that puts Formula 1 fans on the pit wall: detailed standings, telemetry, a live track map and race predictions.
- Context
- WebDon course, HEIG-VD
- Year
- 2025
- Duration
- November 2025
- My role
- Concept, data and UI
- Team
- Solo project
- Tools
- Figma, Ergast, FastF1, OpenF1
The problem
Fans stay spectators: race data is out of their reach.
My answer
An app that makes the race and its strategy visible, live.
The result
5.5/6, for a concept called “original and ambitious”.
Passive spectators
I’ve loved Formula 1 since I was a kid. But watching a race, something is missing: stats, images and onboard cameras are chosen by F1 or the broadcasters. There’s no way to follow what really interests me.
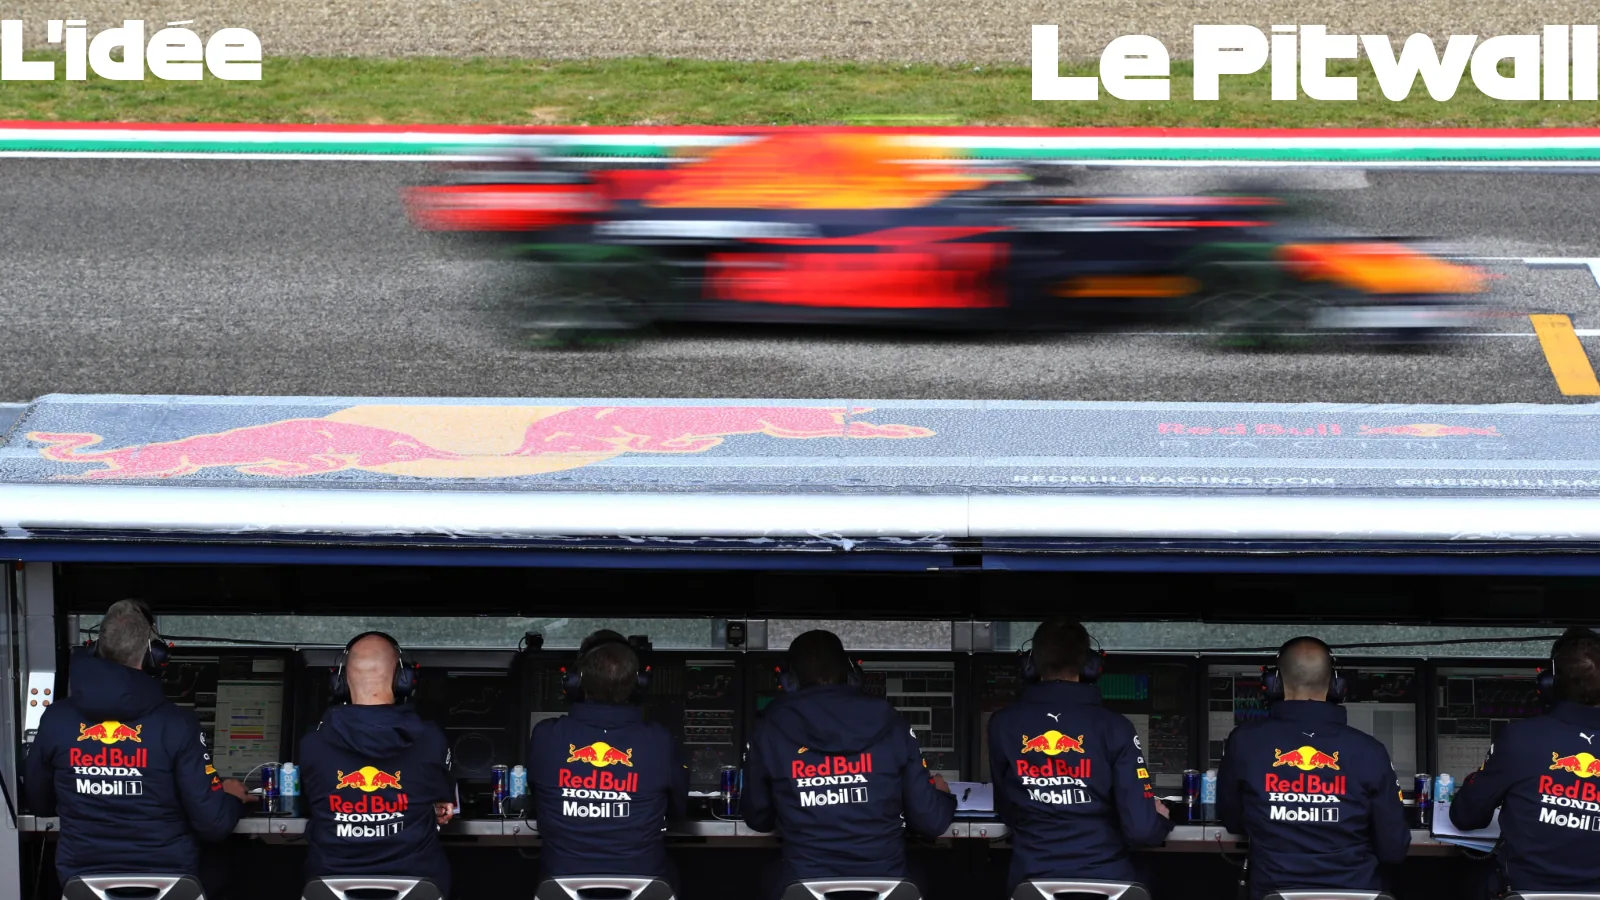
Meanwhile, on the pit wall, engineers analyse the race in real time and make the calls that decide it. My idea: give fans access to that point of view.
Visualise, analyse, predict
01 / 05
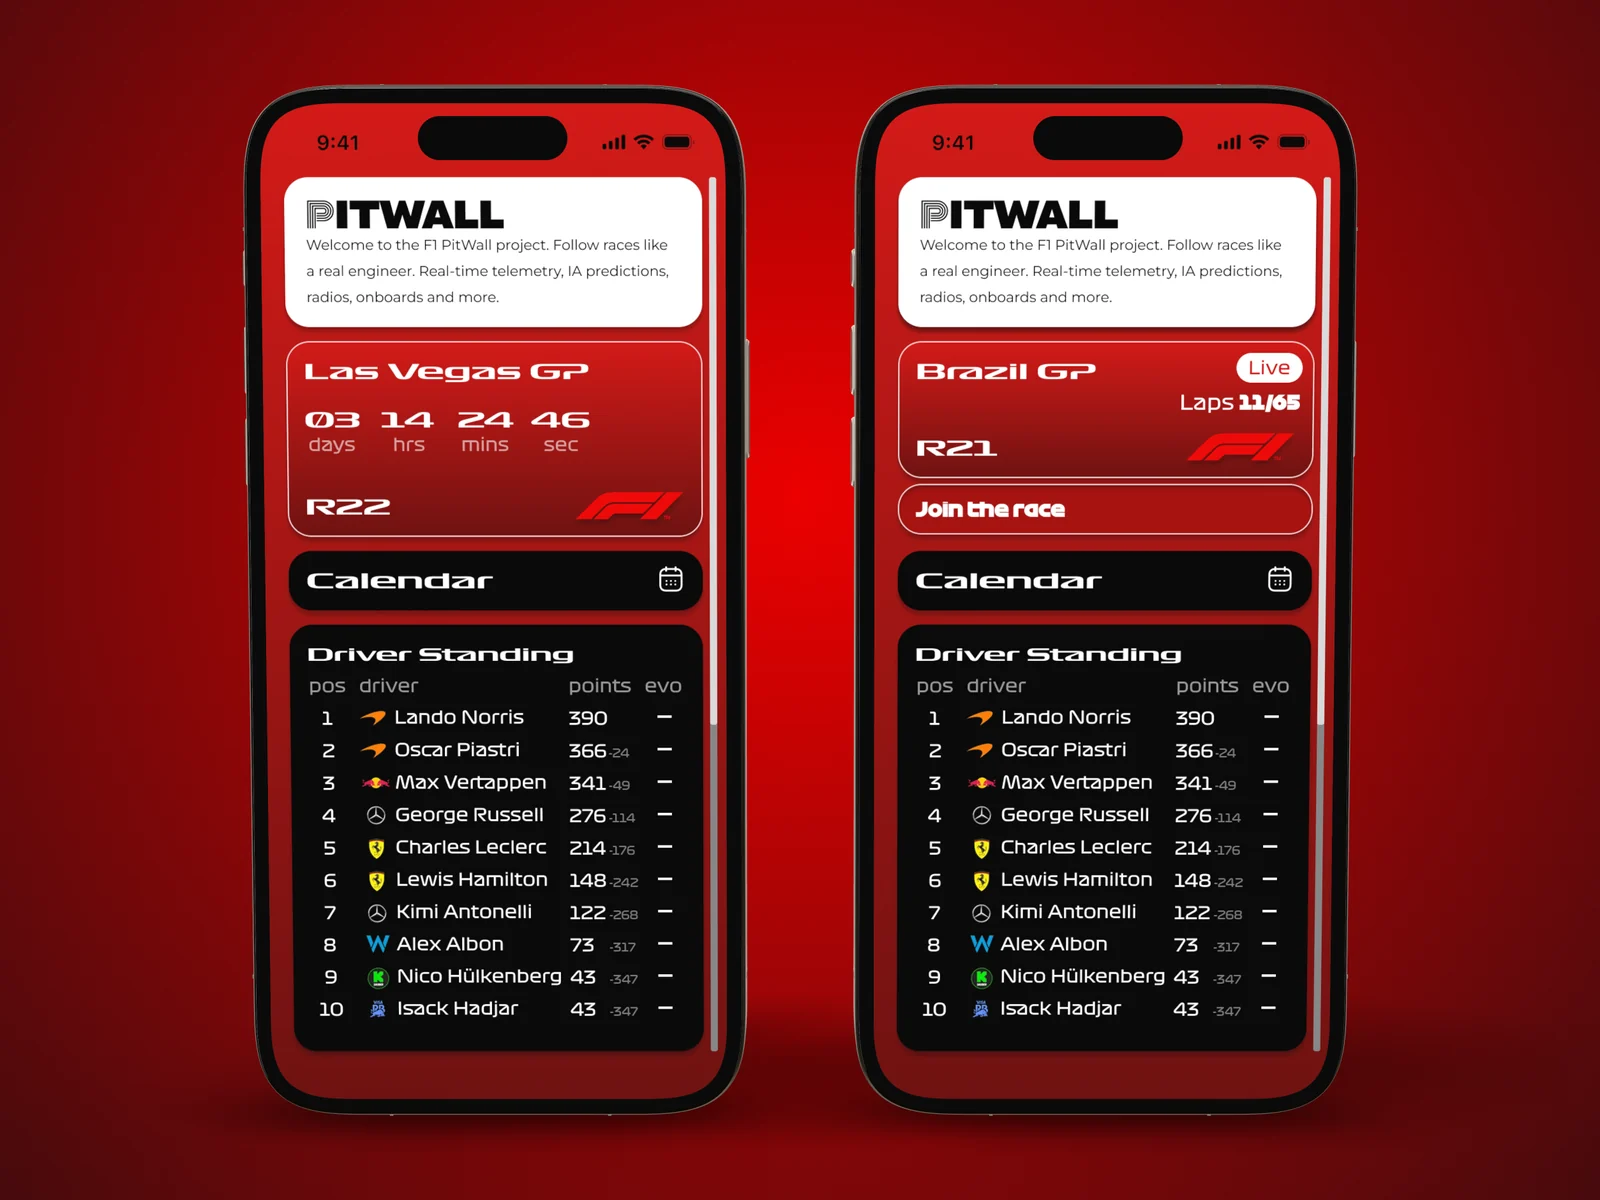
The home screen shows the race in progress or the next one, the calendar and the standings. You join the race in one tap.
02 / 05
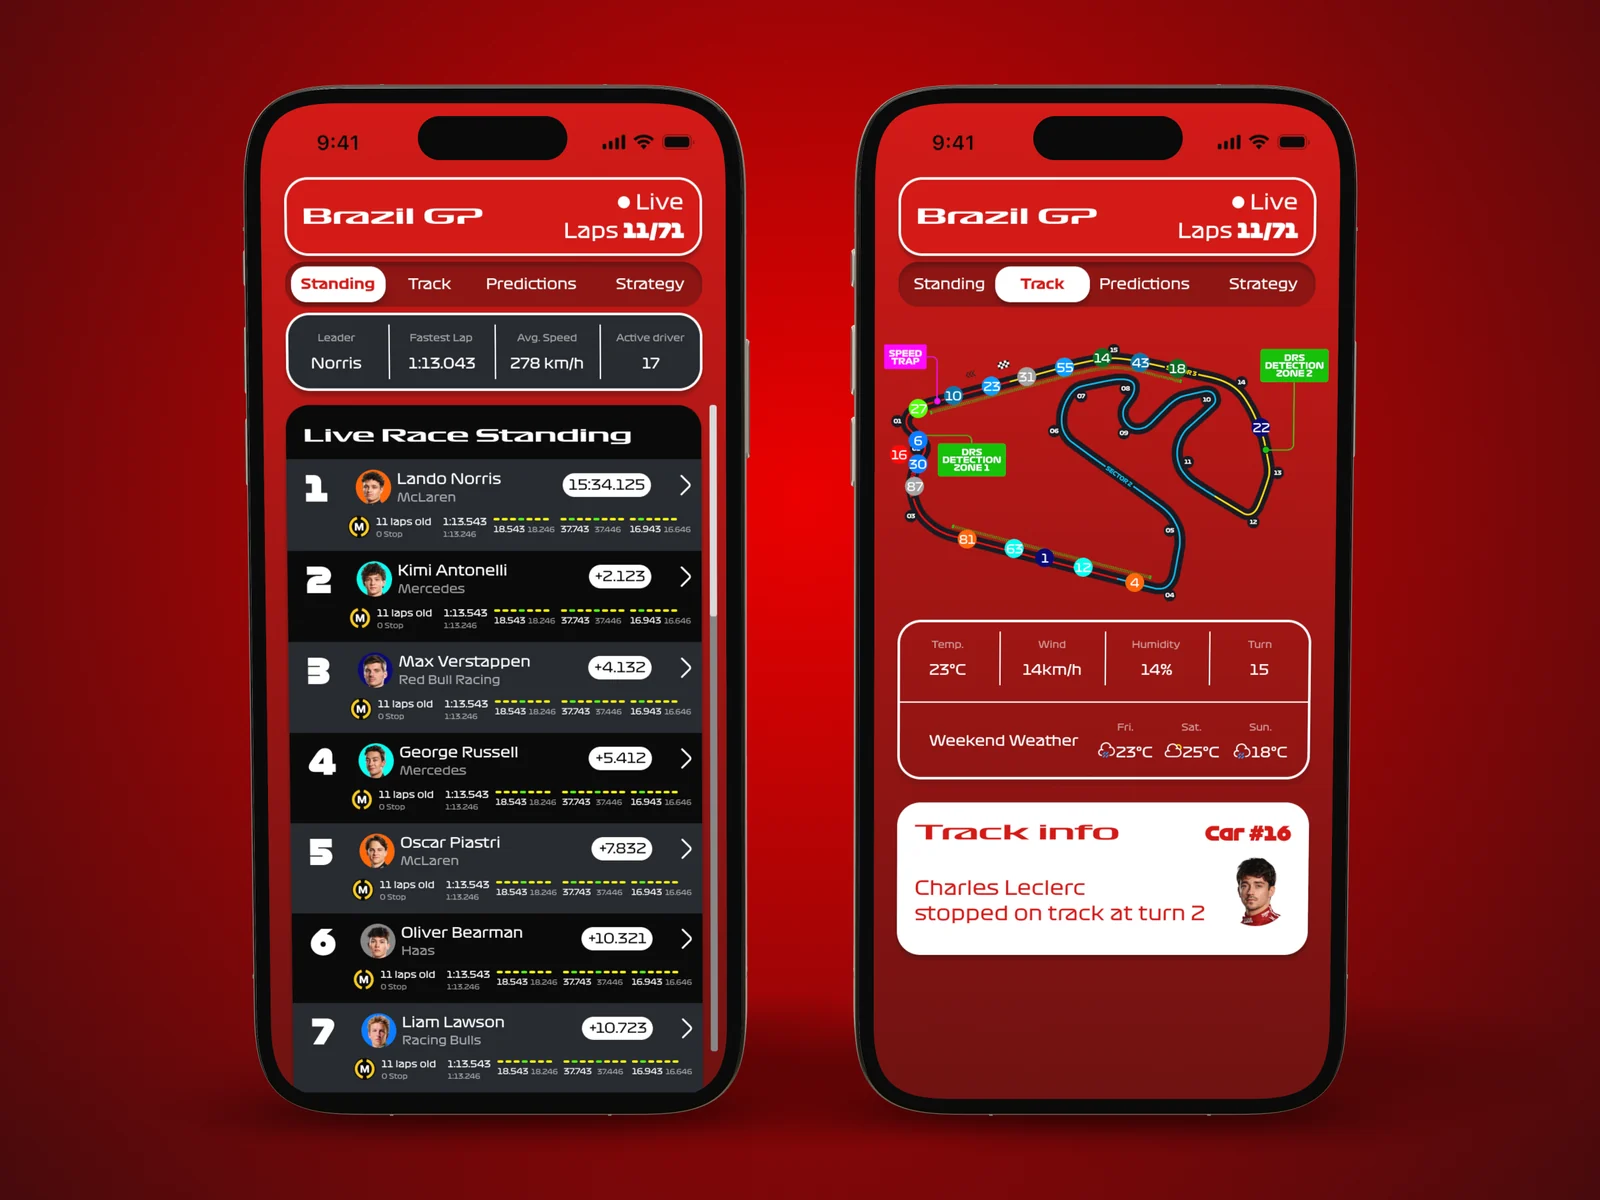
The standings go further than TV: tyre age and compound, pace per sector. And the track map shows every driver’s position, DRS zones, weather and incidents.
03 / 05
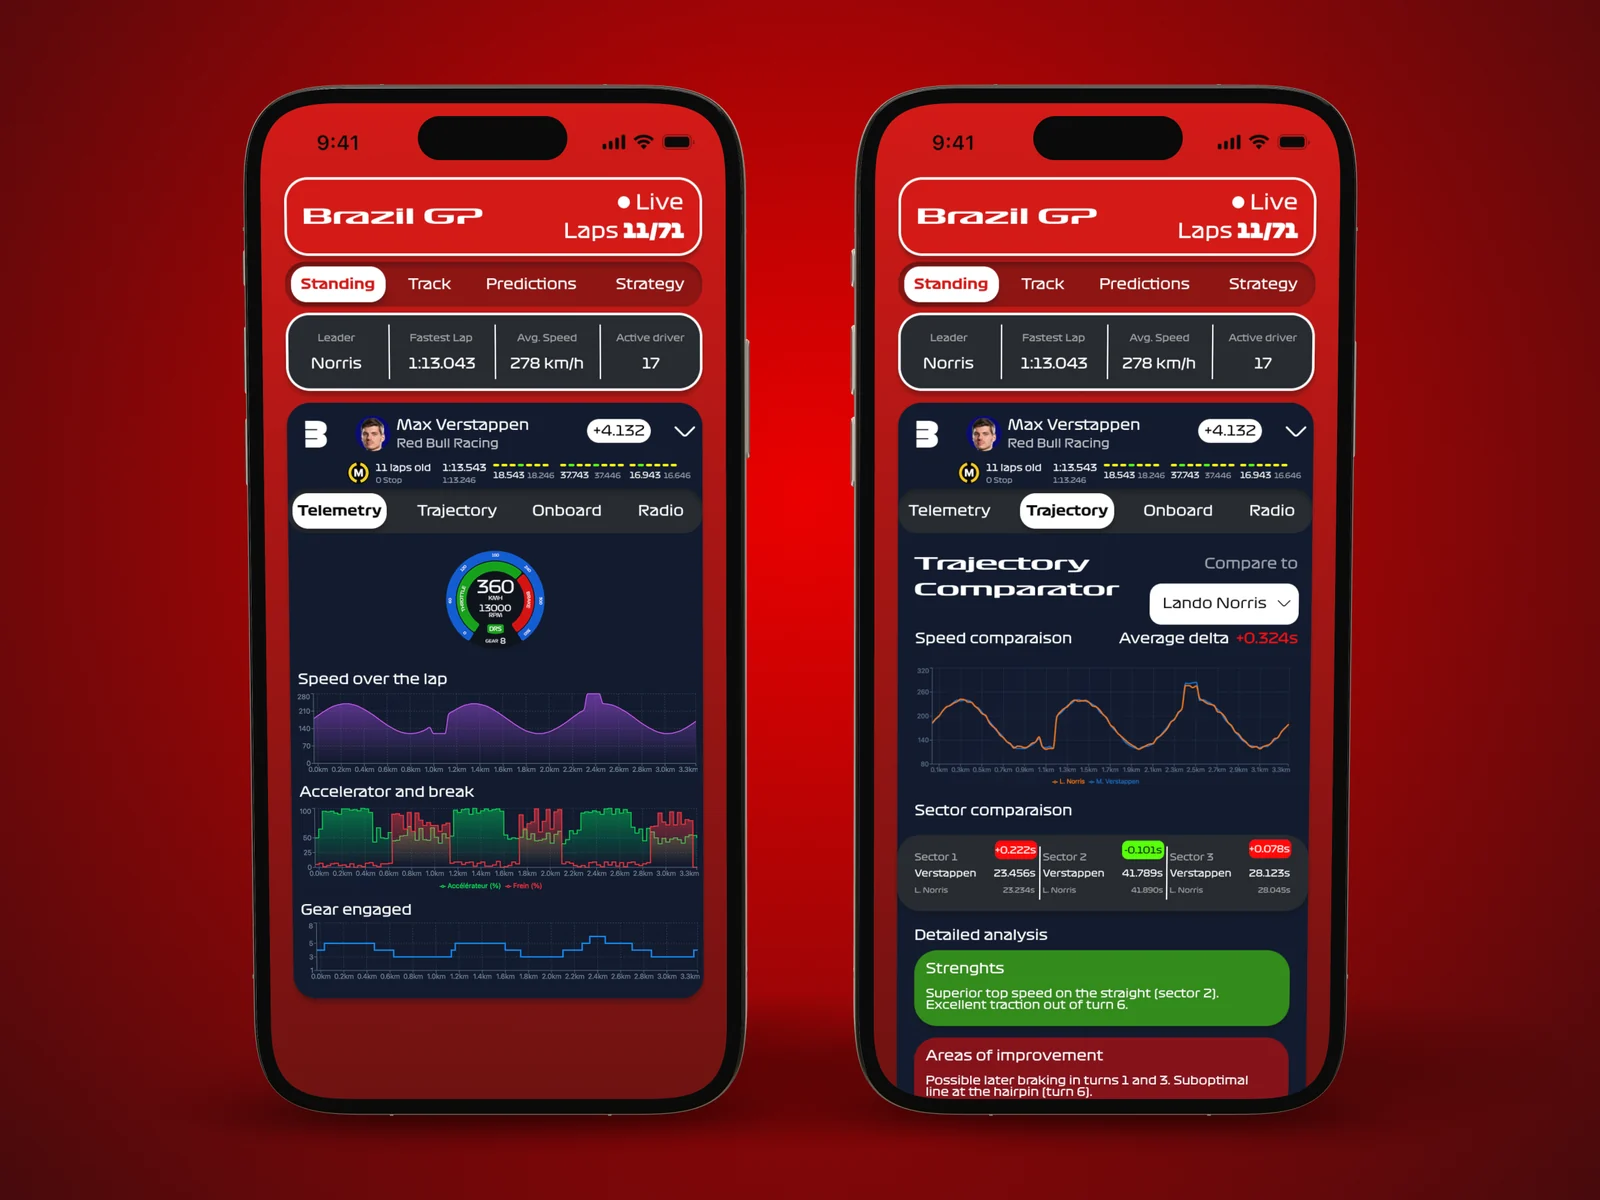
Telemetry turns raw data into readable curves: speed, throttle, braking. And you can compare two drivers’ lines, corner by corner.
04 / 05
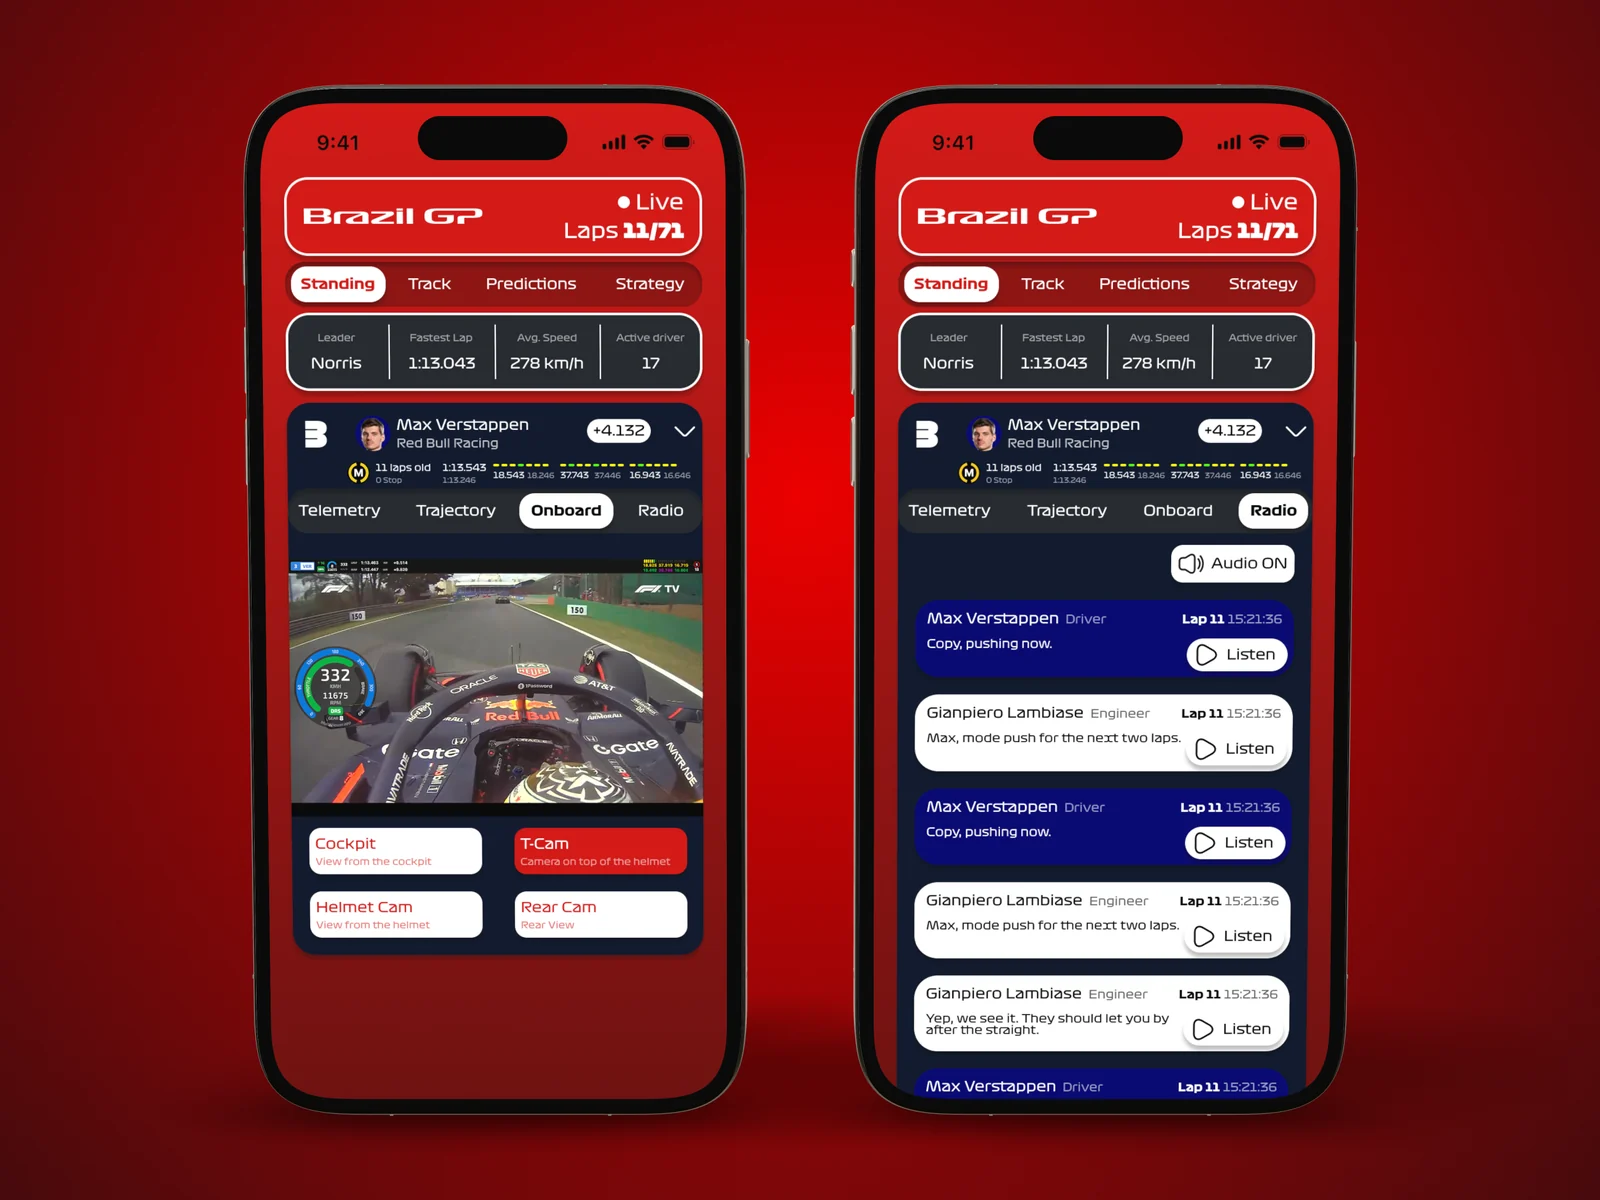
The onboard camera and the radio between drivers and their team, sometimes before it airs on TV.
05 / 05
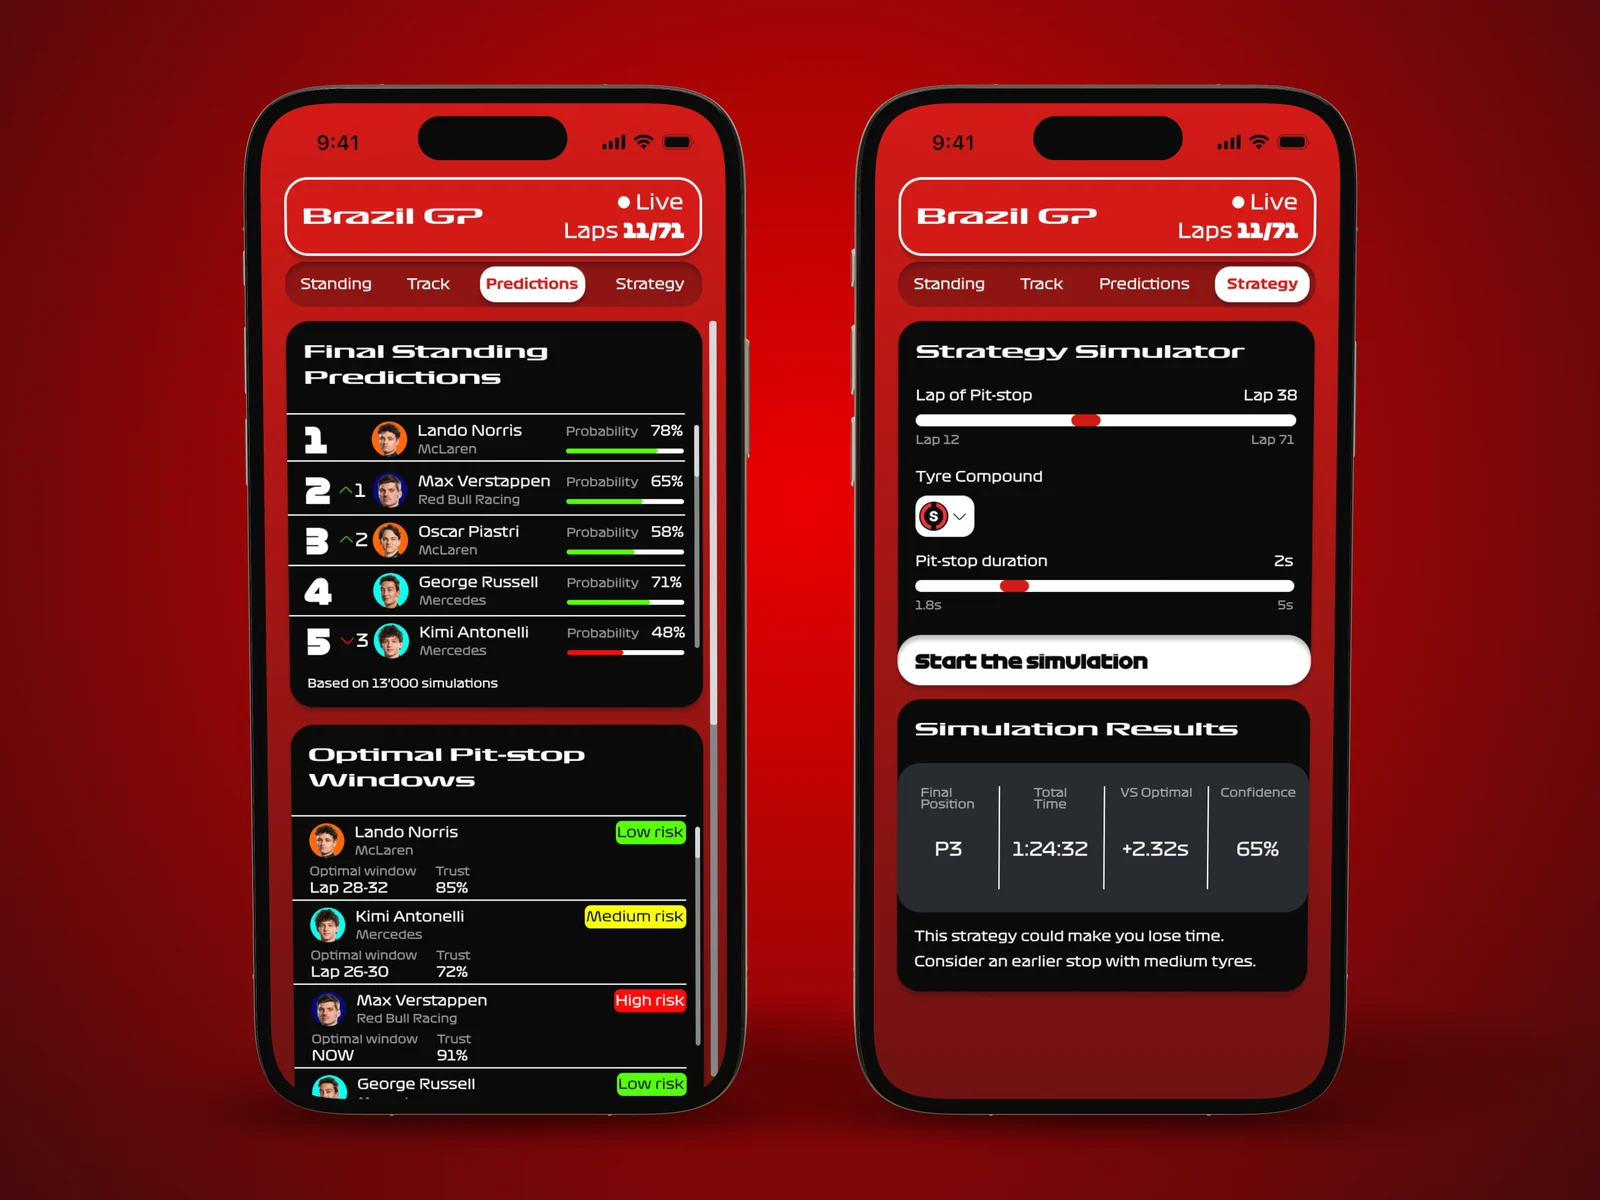
Predictions and the simulator: chances of winning, pit windows, “what if” scenarios and your own strategy to test.
Real data underneath
The concept relies on sources that exist: Ergast for historical results, FastF1 for telemetry, OpenF1 for a prototype, and a licensed official feed for the final version. For every screen, I described exactly the data it would receive, from the live standings to the model’s output.
Predicting the end of the race
For the predictions, I proposed a hybrid model. LightGBM estimates each driver’s lap time, with its uncertainty, from their pace, tyres, the weather and their track history. Then a Monte-Carlo simulation plays out thousands of race endings, accounting for pit stops, traffic and safety cars.
Ergast · FastF1 · live
Data
Pace, tyres, weather, track history
Machine learning
LightGBM
Expected lap time and uncertainty
Simulation
Monte-Carlo
Thousands of simulated race endings
The same approach recommends the best pit strategy: zero, one or two stops are simulated, and the app shows the three best options with the expected gain.
Results
- project grade
- 5.5/6project grade
- views: home, standings, track, telemetry, strategy
- 5views: home, standings, track, telemetry, strategy
- open data sources for a first prototype
- 3open data sources for a first prototype
« An original and ambitious concept, remarkable use of data and solid technical aspects. »
What I take away
Starting from a passion pushed me deep into data and algorithms. The feedback also taught me to simplify: the interface was too busy, and the concept’s value would have been clearer with concrete use cases.
The logical next step: a first prototype on open data, then tests with real fans to lighten the interface.
Credits
- Luca Leone · Solo project
WebDon course of the Bachelor in Media Engineering, HEIG-VD. Formula 1 data and brands used for illustration only.