
UX/UI design · Mobile app
OceanSight
People at sea see the waste. They don’t know who to report it to.
With Sacha Loskov and Romain Blanchard, I designed a mobile app that lets anyone report ghost nets and plastic islands, then join a mission to clean them up.
- Context
- UI/UX Fundamentals course, HEIG-VD
- Year
- 2026
- Duration
- One semester
- My role
- UX/UI design, from research to prototype
- Team
- 3 students
- Tools
- Figma, FigJam
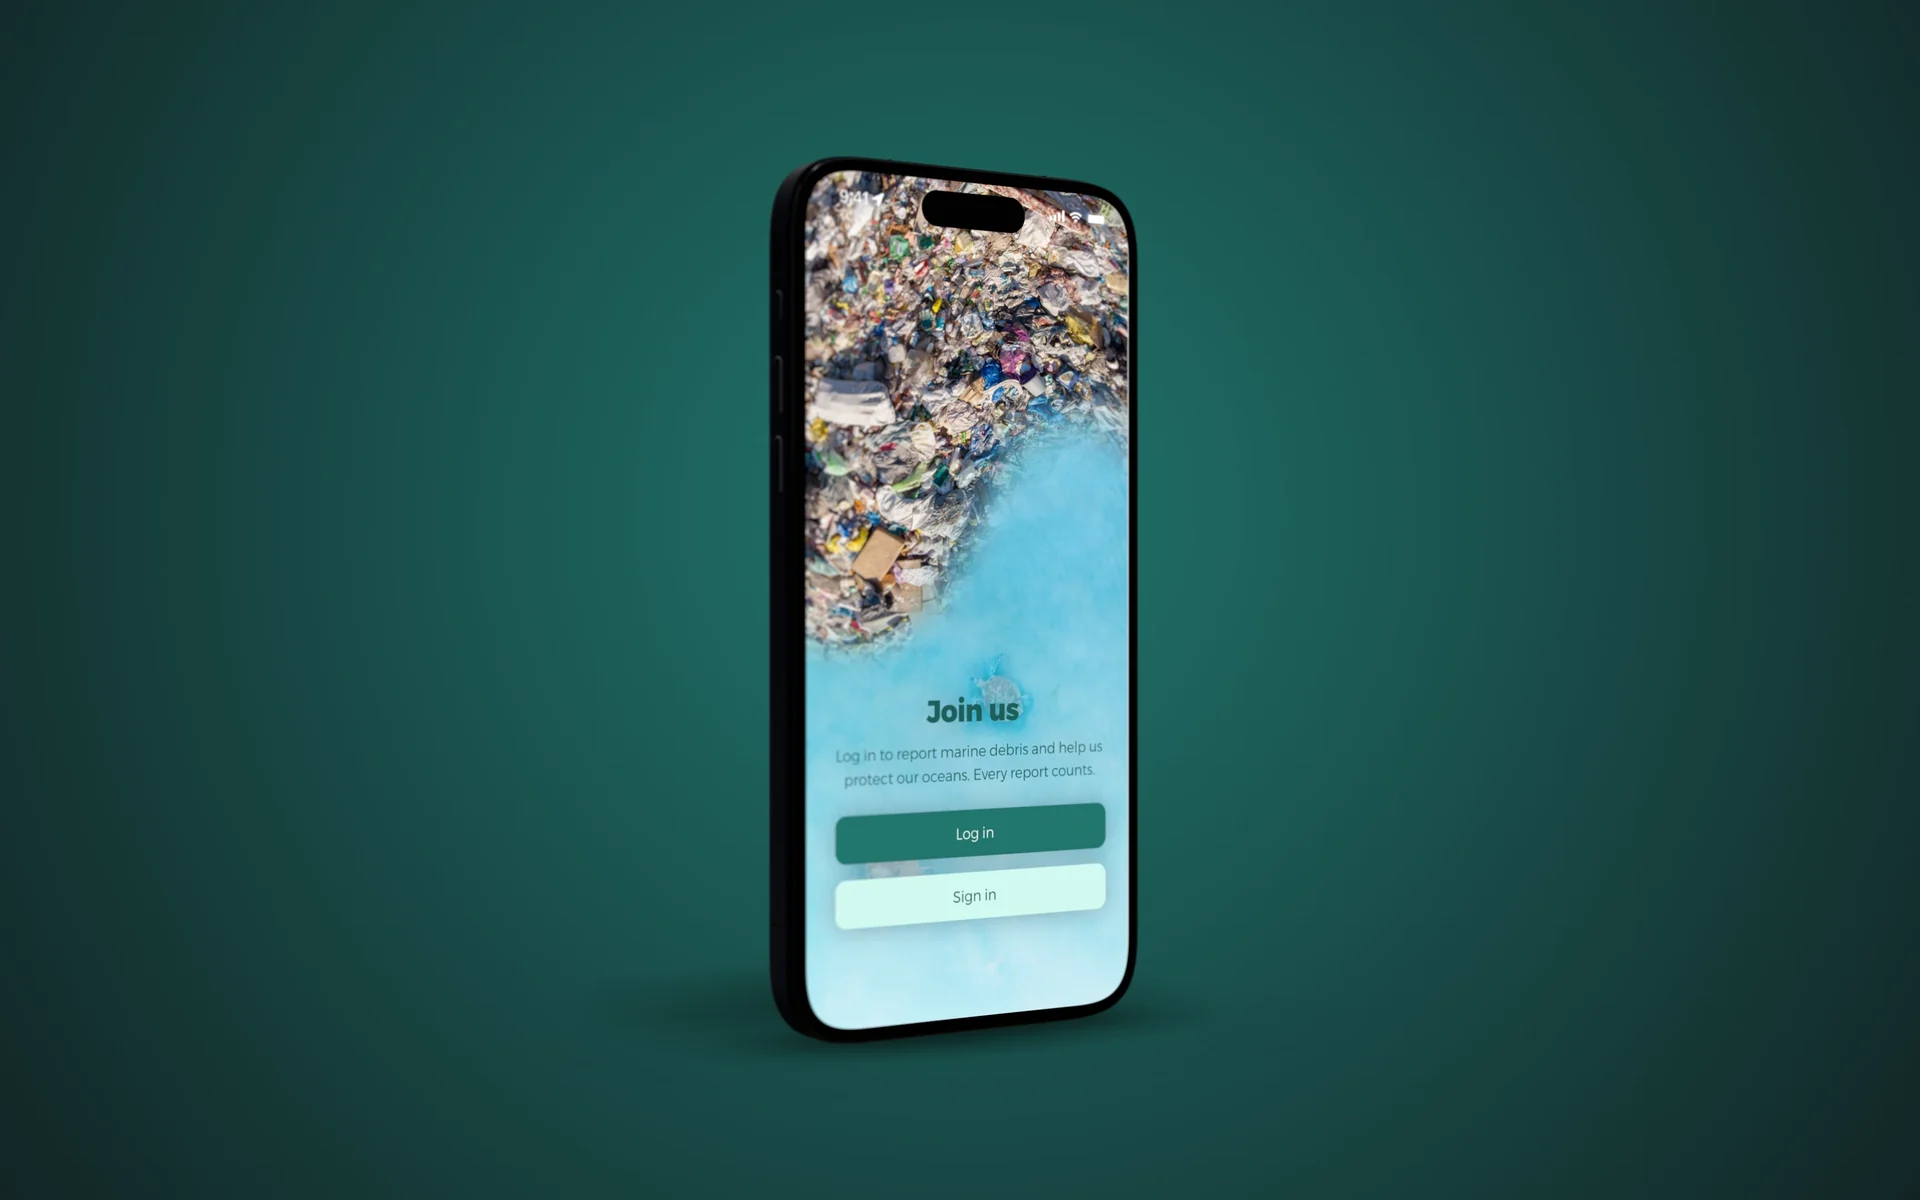
The problem
Fishers, sailors and NGOs come across waste at sea without knowing how to report it.
Our answer
A collaborative app: report, join a mission, track your impact.
The result
6/6 in UX and 5.4/6 in UI, after testing with five people.
An ocean running empty
The course asked us to pick one of the UN Sustainable Development Goals and answer it through design. After three mind maps, we chose life below water: pollution there is often invisible, and that’s where an app could act quickly.
- tonnes of plastic end up in the sea every year
- 11 miotonnes of plastic end up in the sea every year
- aquatic species under threat
- 6’500aquatic species under threat
- less marine biomass by 2100
- 17%less marine biomass by 2100
We focused on two concrete threats: abandoned fishing nets, which keep trapping animals, and floating islands of plastic.
Three profiles, one roadblock
We looked at the problem through three profiles: a fisher who refuses to abandon his nets but feels powerless, a sailor who comes across waste without knowing who to contact, and an NGO coordinator swamped with imprecise reports.
They all hit the same wall: they see the problem, but nothing lets them report it simply, or take action.
Three ideas, one kept
It all started with paper mind maps around three UN goals, then one question: how can we simplify the reporting of abandoned nets and plastic islands? We explored three leads: an eco-score that rewards fishers, a tool that predicts accumulation zones from ocean currents, and a reporting app open to everyone.
We kept the third. It is the most accessible, the one that rallies the most people around a common cause, and every report creates geolocated data useful to NGOs and scientists alike.
The app
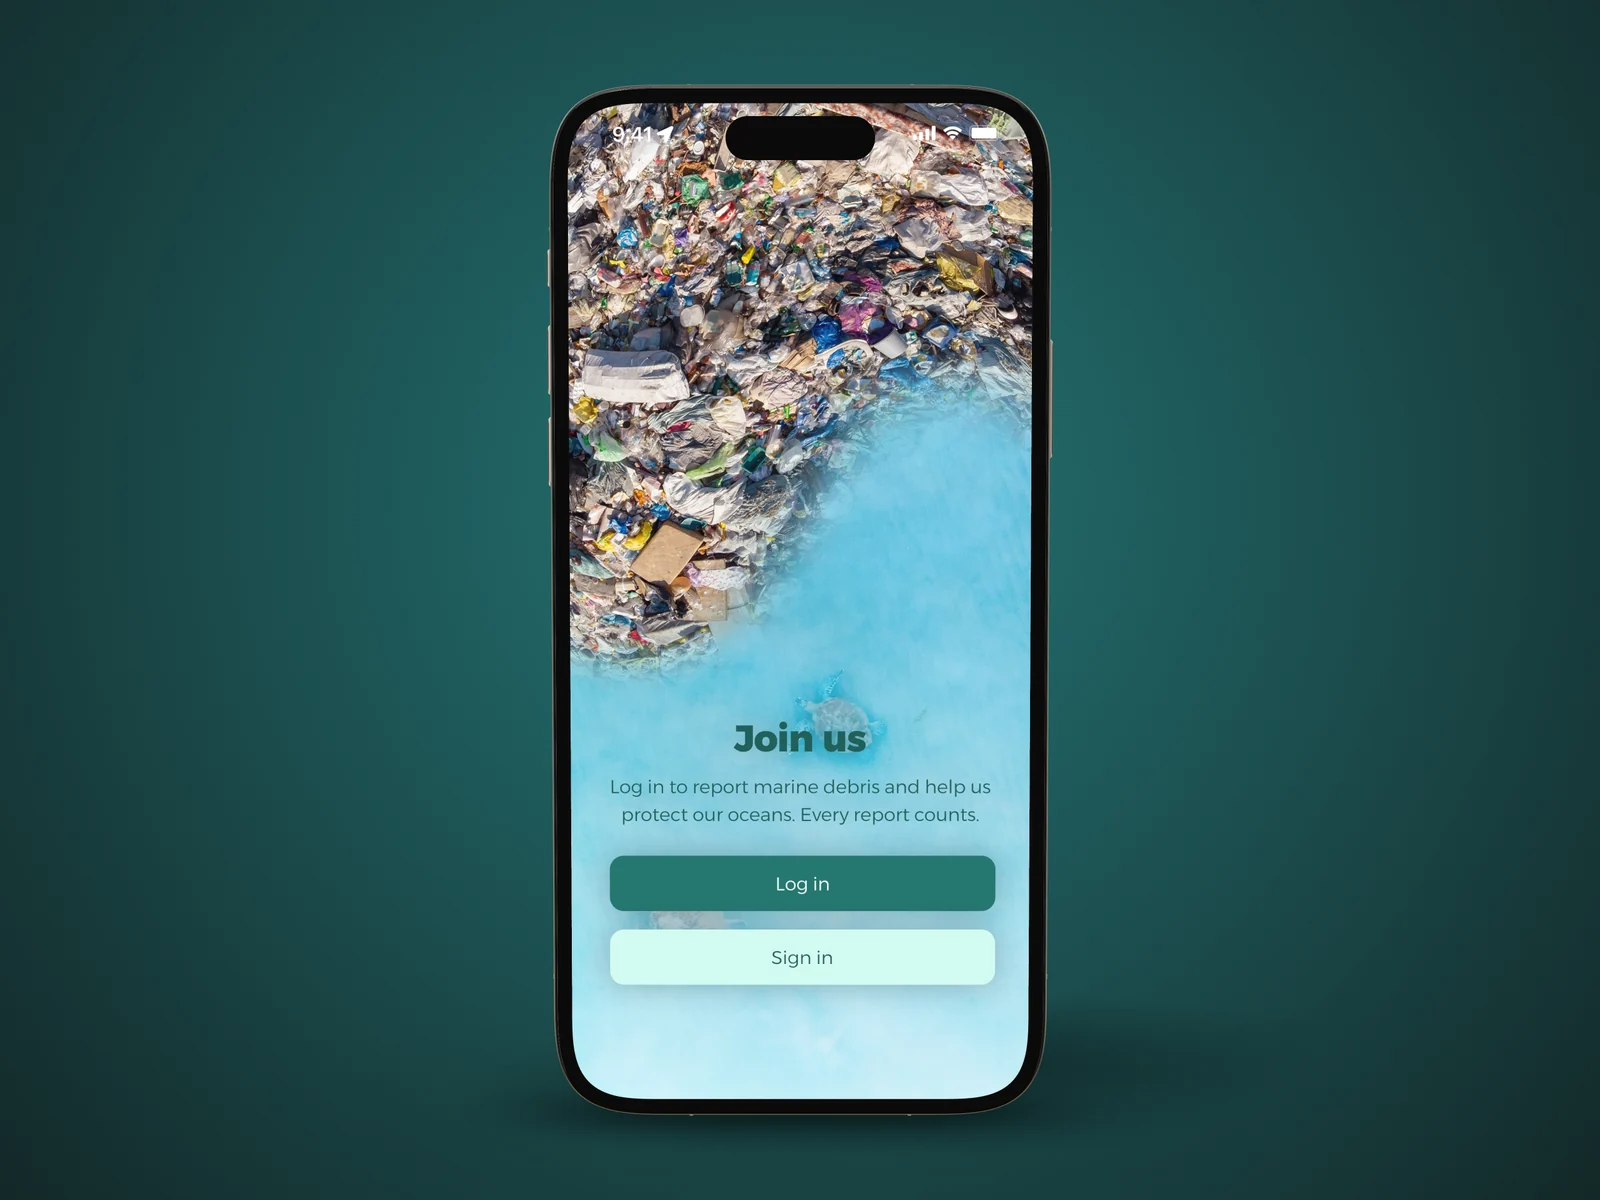
01 / 05
Join the community: one account is enough to report and take part.
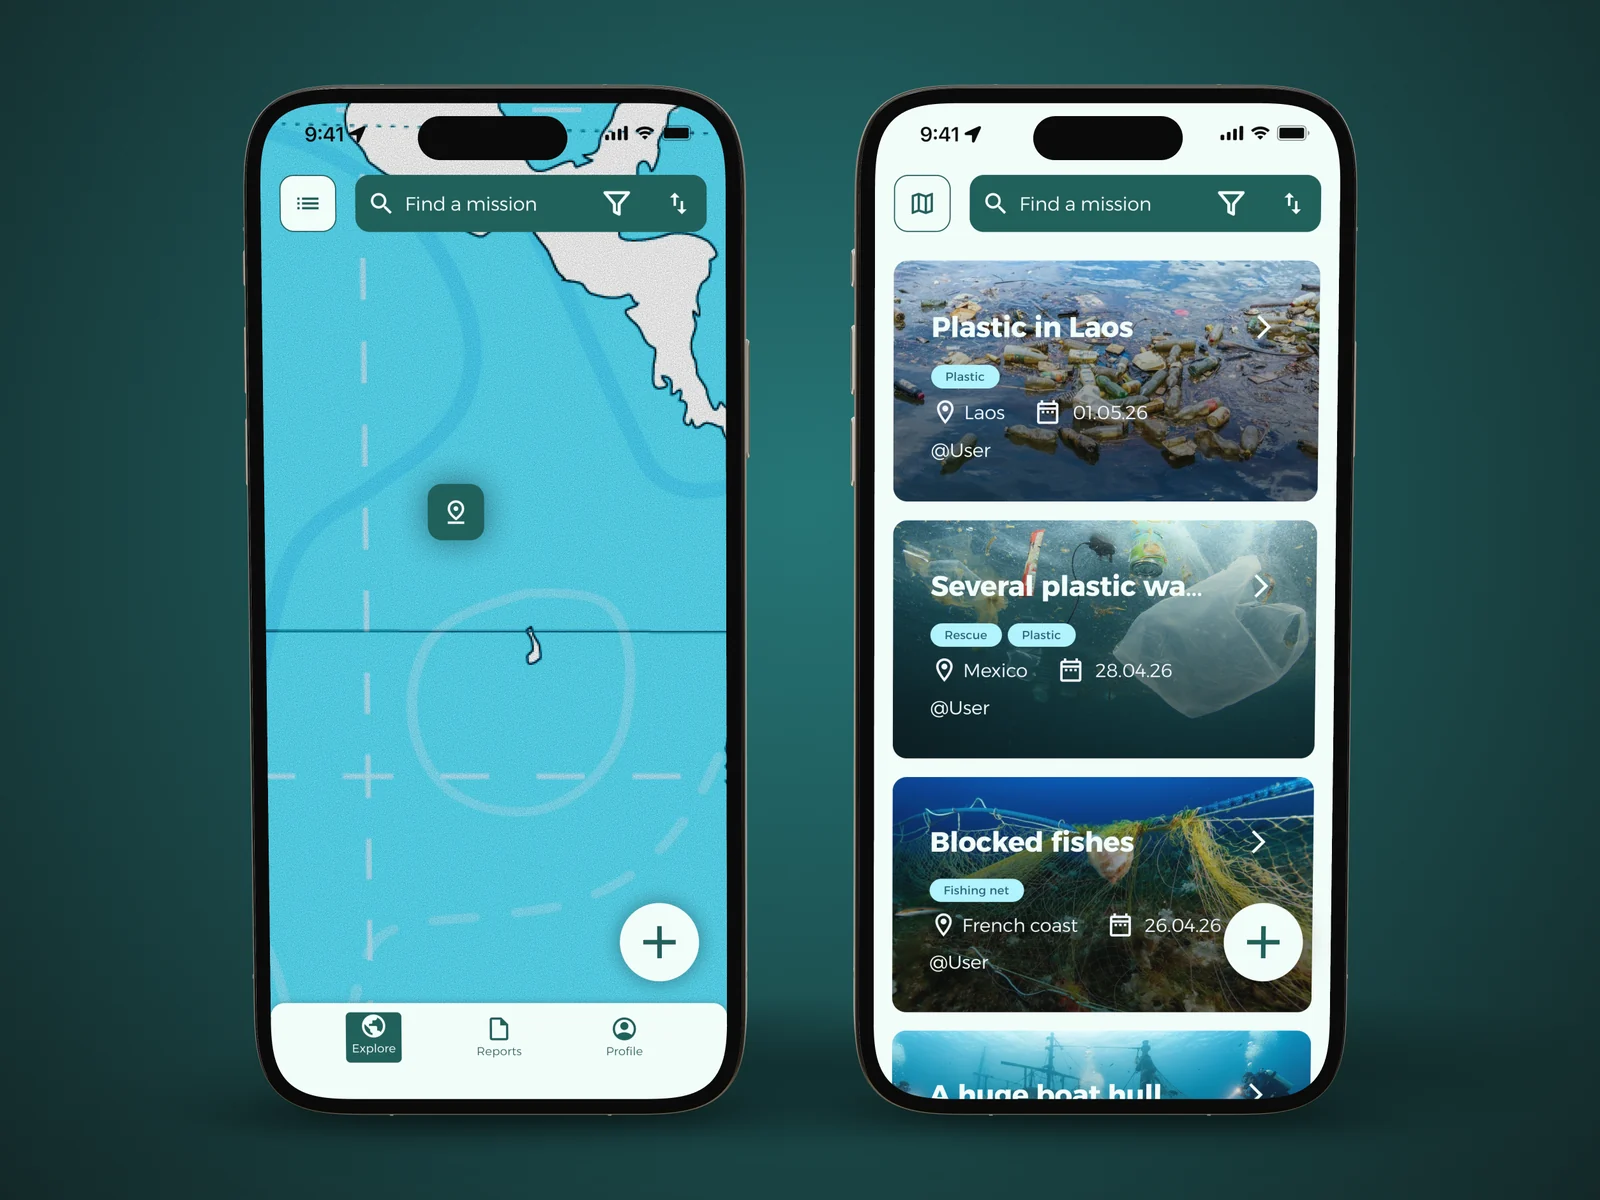
02 / 05
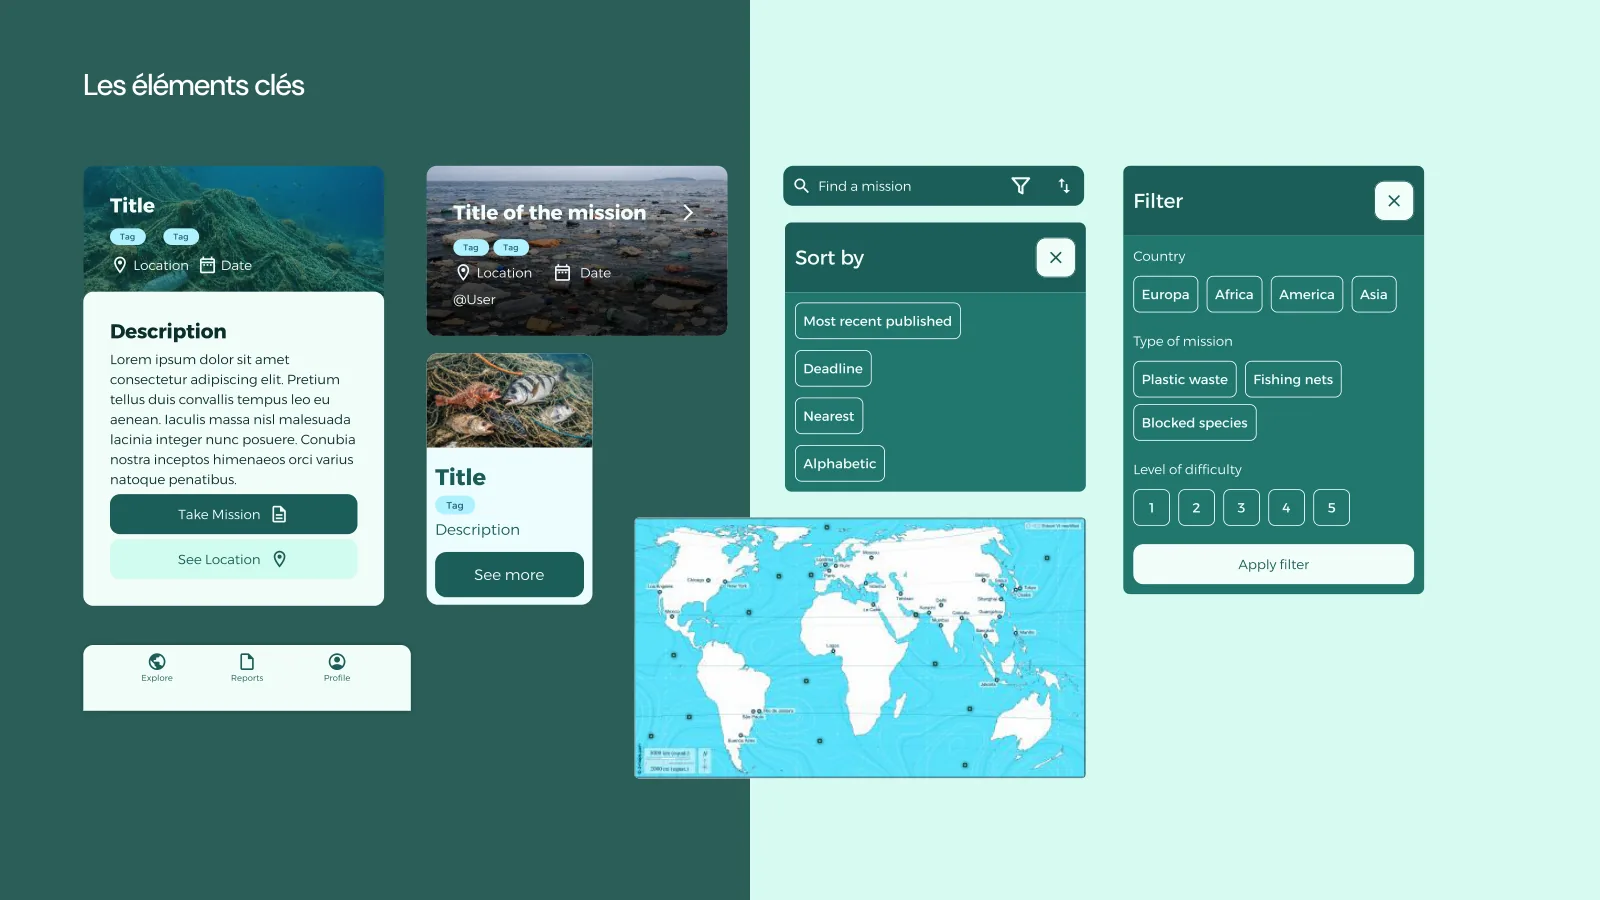
Find a mission on the map or in a list, filtered by region, type of waste or difficulty.
03 / 05
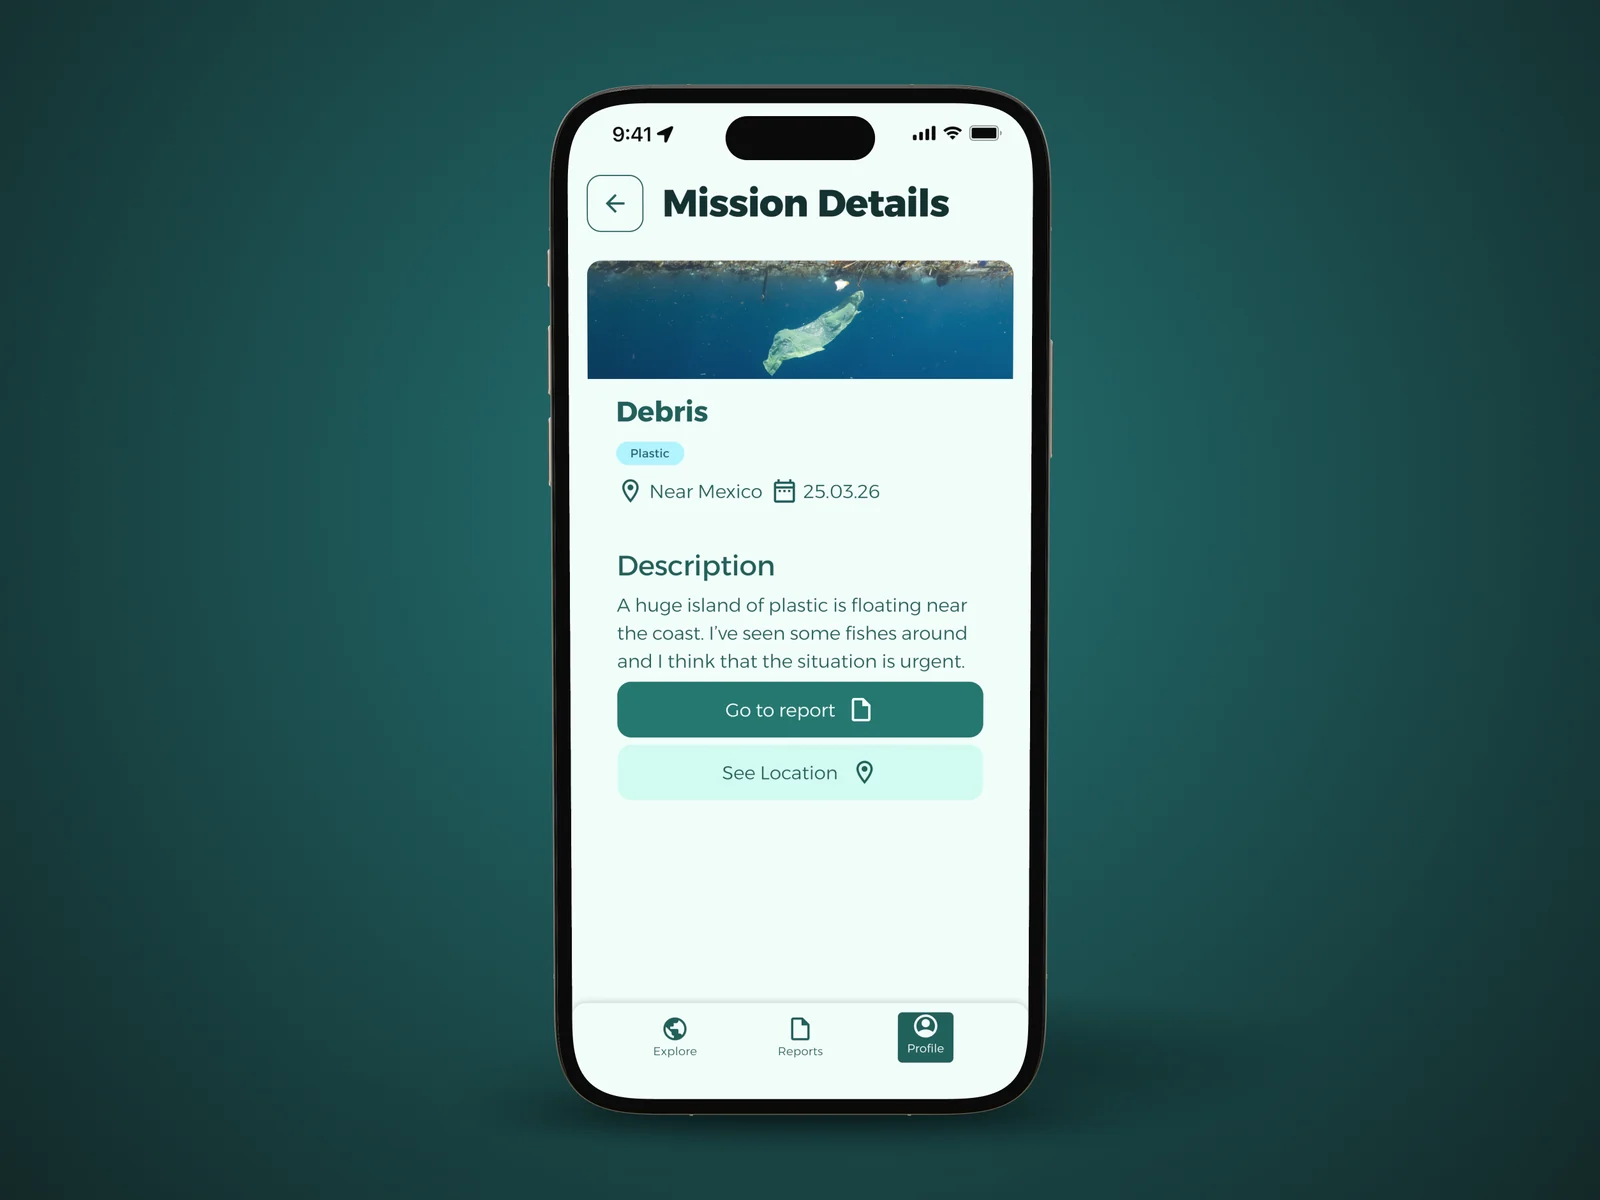
Each mission shows the place, the date and what was spotted. You join it in one tap.
04 / 05
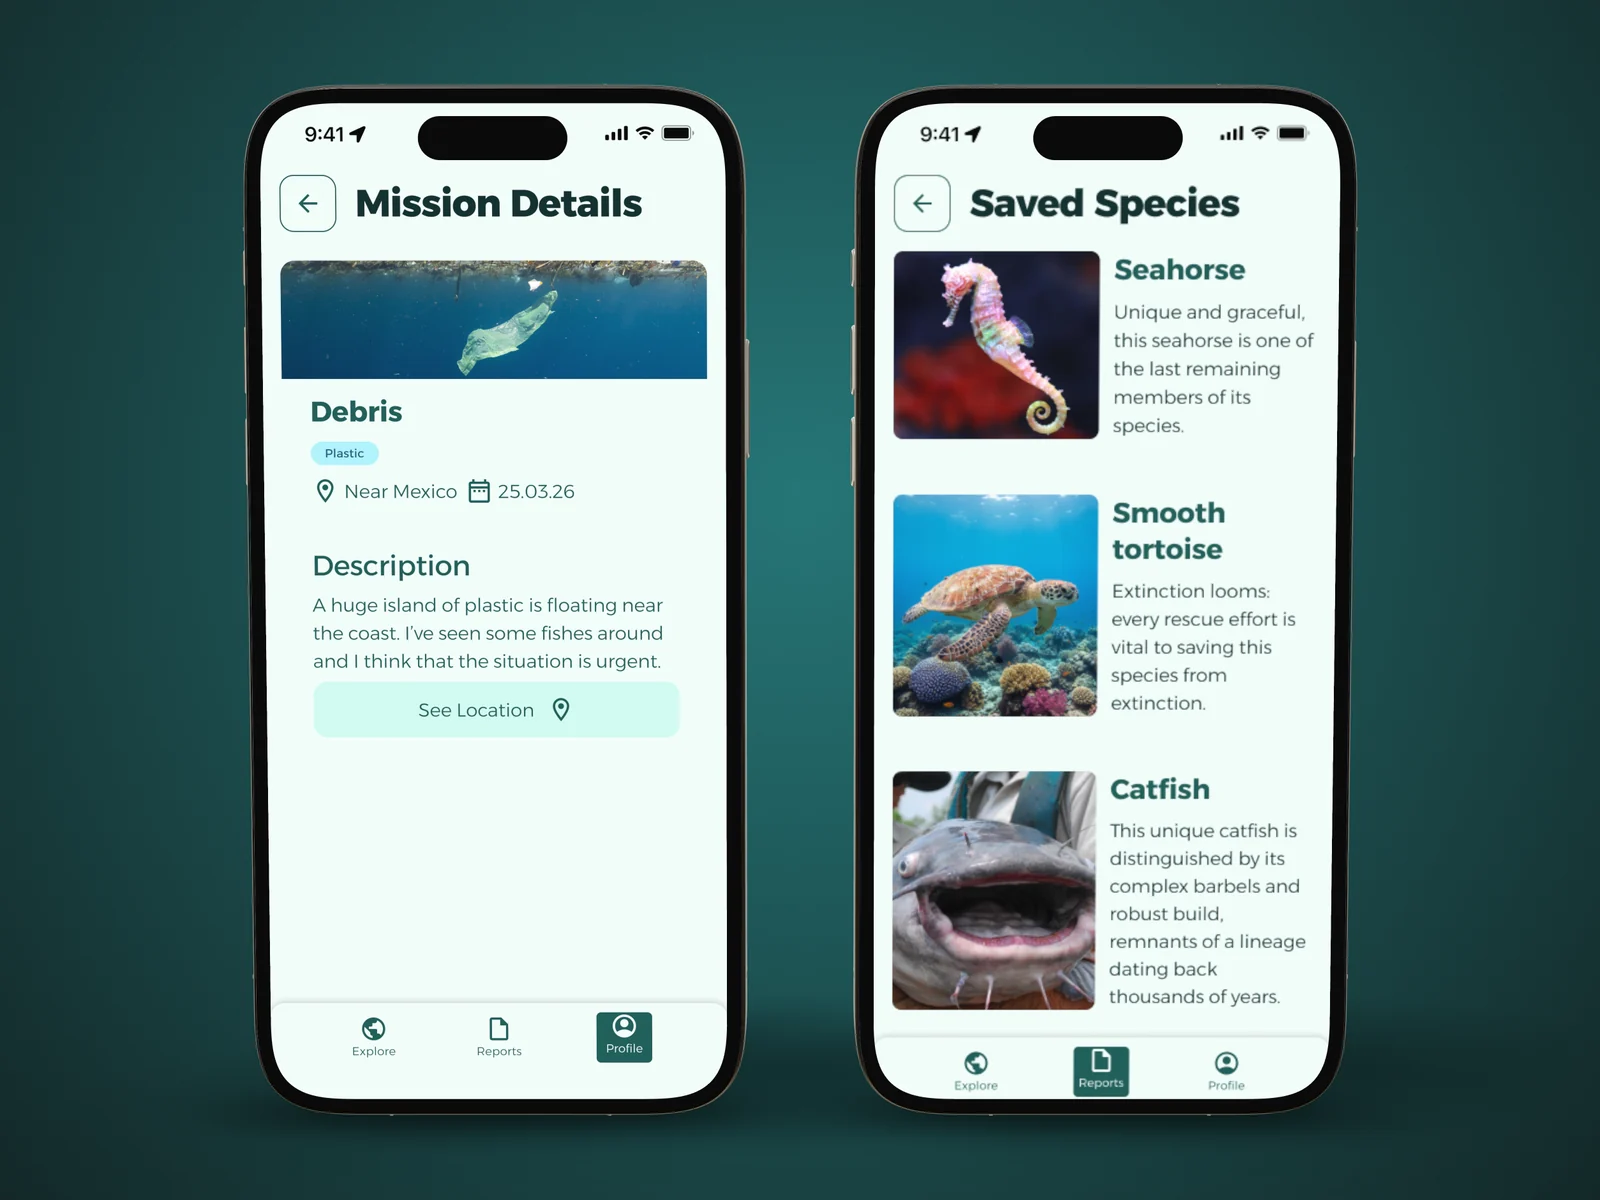
After a mission, the report documents the action and the species saved, each with its own card.
05 / 05
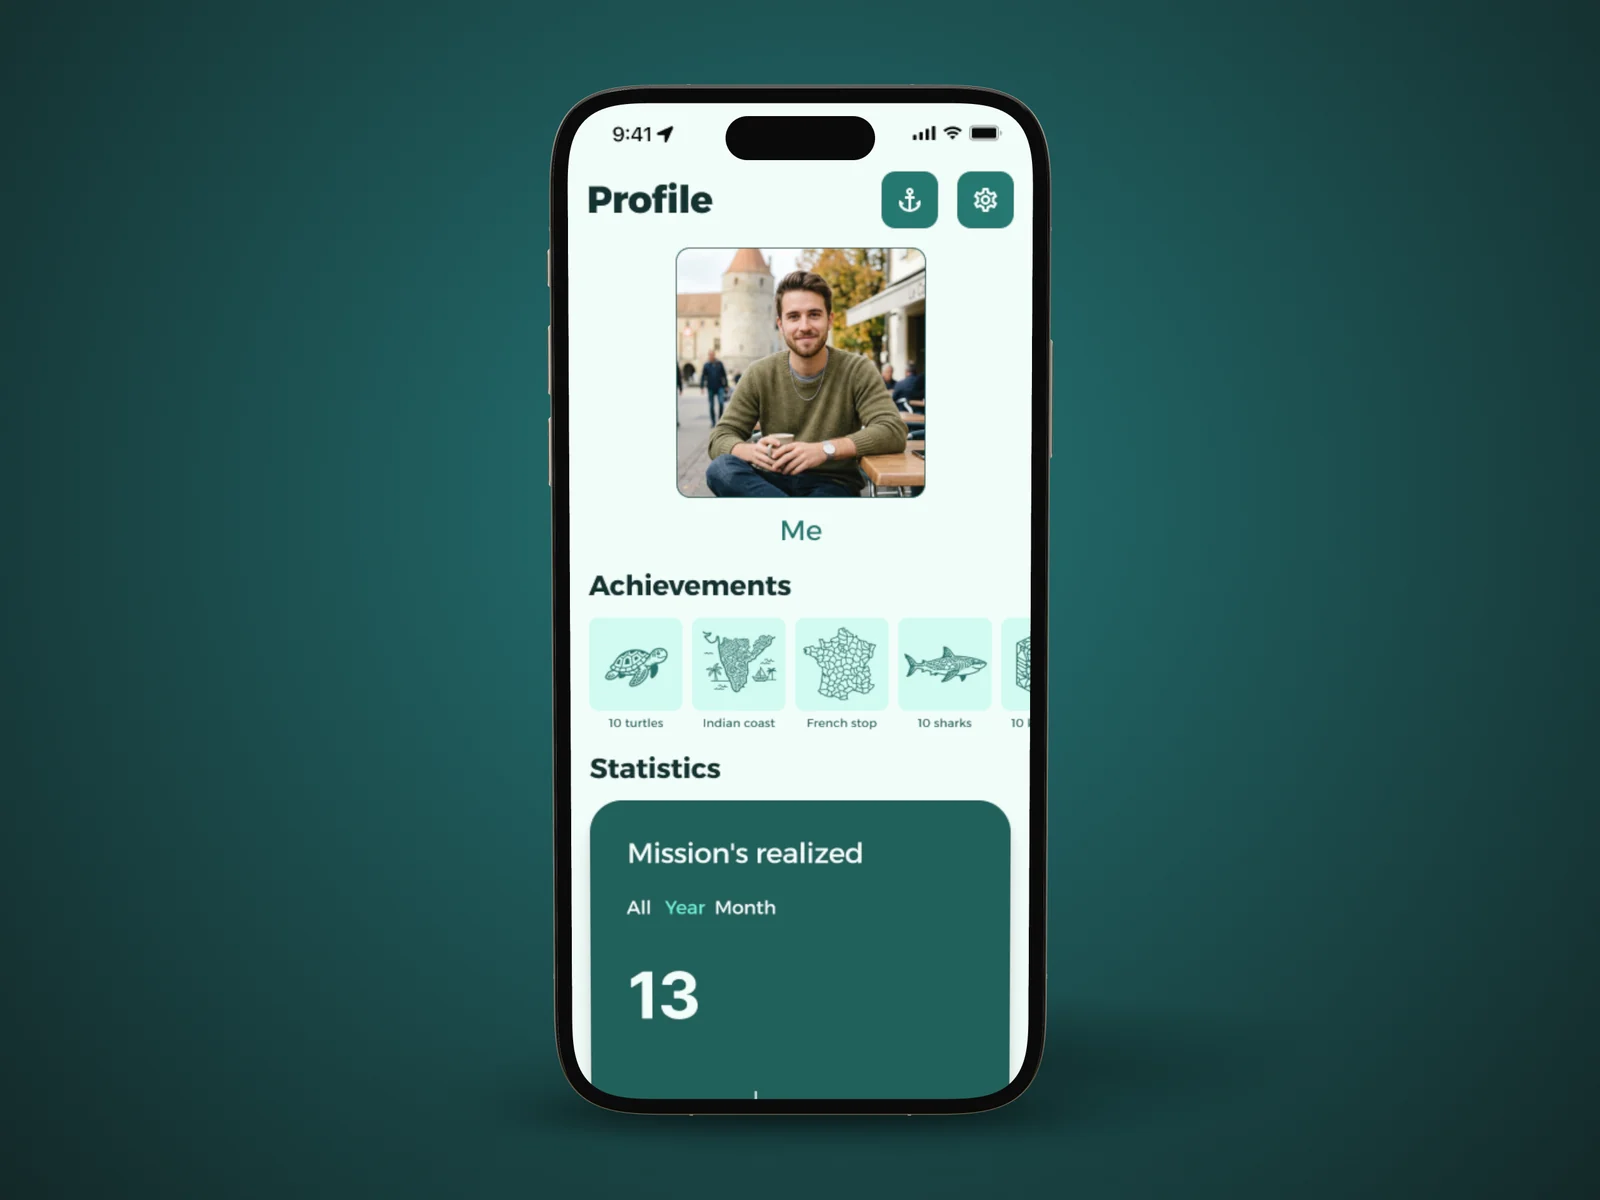
The profile shows your impact: missions completed, kilos of plastic removed, species saved, badges.
An ocean-coloured identity
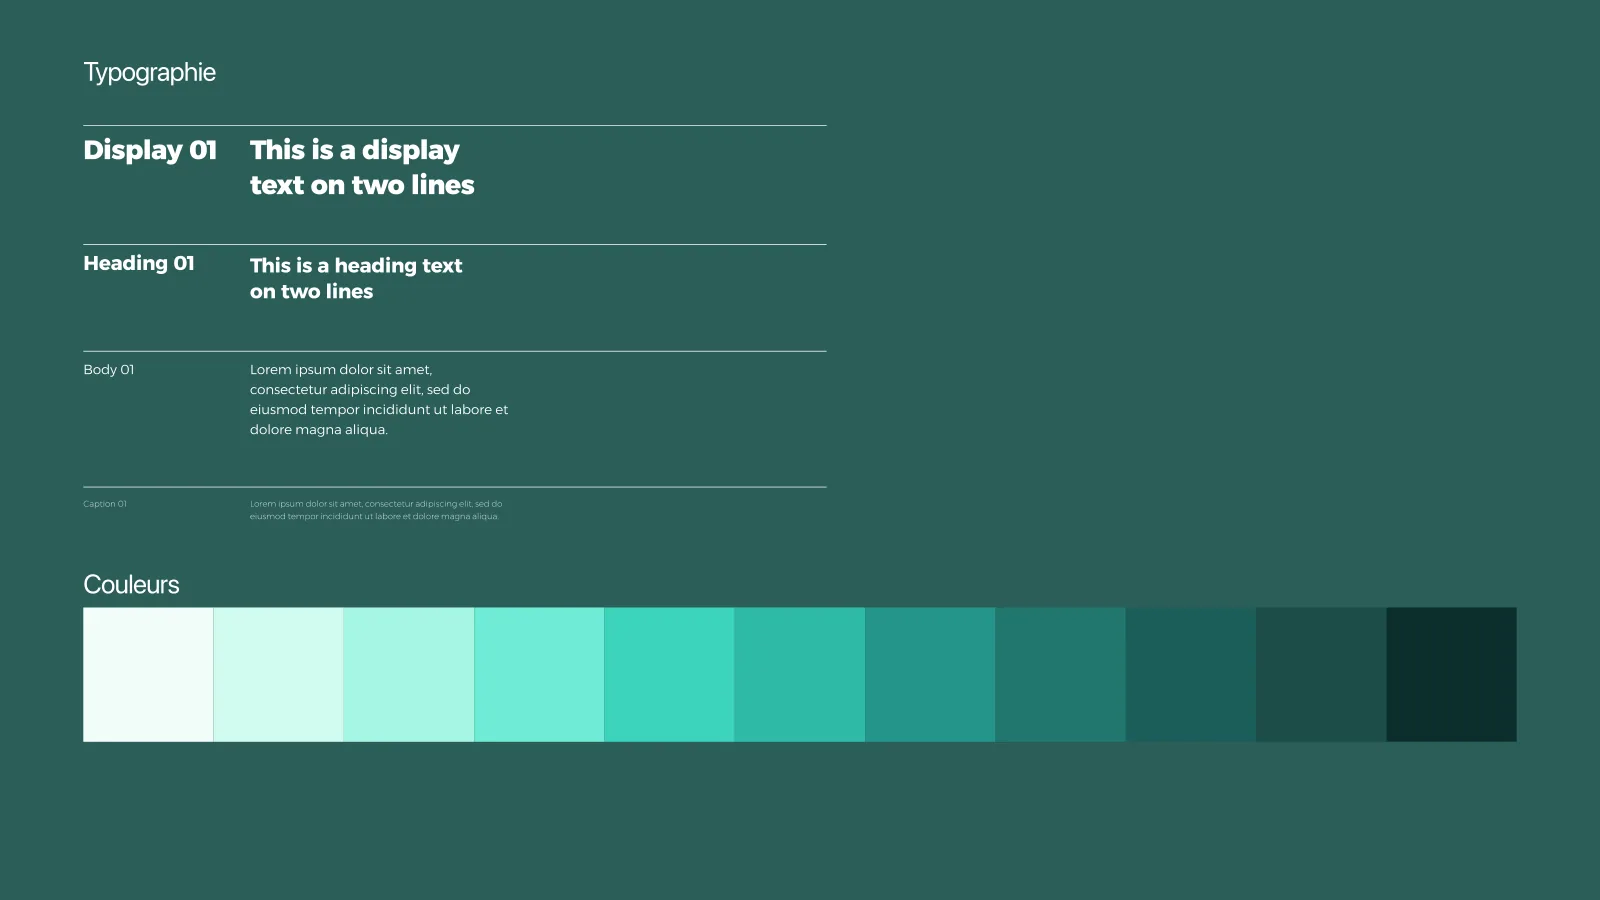
For the interface, we built a complete design system: a palette of ten sea-green shades, a clear type hierarchy and a library of reusable components, from mission cards to filters.
Tests and results
Five people tested the prototype. Their feedback, such as scrolling through species or confirming filters with a button, let us build in four improvements before the end.
- UX grade
- 6/6UX grade
- UI grade
- 5.4/6UI grade
« The design system is solid and shows a good understanding of accessibility, grid and Gestalt principles. »
What I take away
For the first time, I followed a real UX process end to end: from research to personas, from the idea to the prototype, then to testing. The testers’ feedback was invaluable; every friction they found made us better.
I’m proud of the road we travelled with Sacha and Romain, and even more of what we learned together.
Credits
- Luca Leone · UX/UI design
- Sacha Loskov · UX/UI design
- Romain Blanchard · UX/UI design
UI/UX Fundamentals course of the Bachelor in Media Engineering, HEIG-VD. Supervised by Marie Kuter and Patrick Donaldson.